

Cai Fang (蔡昉)*
The Chinese Academyof Social Sciences
Abstract:Thispaper creates an analytical framework for ongoing China ’s economic slowdown andreveals the major factors affecting potential growth rate. First, proceedingfrom the factors that led to a decline in China ’s potential growth rate, thispaper demonstrates that the slowdown since 2012 is not caused by demand-sideshocks but is a natural result of the demographic transition and the change ofeconomic development stage that stemmed from supply-side factors. It istherefore suggested that the demand-side perspective for cyclical analysis mustbe abandoned and the supply-side perspective for growth analysis ought to befollowed. Secondly, this paper argues that it is theoretically unfounded andempirically unconvincing for existing literature based on the growthperspective to simply apply the statistical pattern of “regression towards themean” to forecast China’s growth outlook and thus arrive at pessimisticconclusions. On this basis, this paper identifies a host of initiatives thatcan significantly increase potential growth rates and proposes policyrecommendations for deriving reform dividends from supply-side structuralreform.
Keywords:growthslowdown, potential growth rate, supply-side, dividends of structural reform
JEL Classification Code: O40, O38, L16
1. Introduction
As a global phenomenon, economic slowdown hasbeen widely debated in the business community and economics academia. When viewedin the context of middle-income countries, economic slowdown finds expressionin another topic: the “middle-income trap.” In reality, both the causes andmanifestations of economic slowdown vary across countries, with each requiringa different perspective. Chinese and international scholars have put forwardinsightful yet different ideas on the causes and countermeasures of globaleconomic slowdown and its impact on world economic outlook. Their differences inviews are more striking when it comes to economic slowdown in a particularcountry.
Regarding the reasons for China ’sslowdown after 2012, opinions differ and sometimes are even polar opposites ofeach other among opinion leaders, economists and even decision-makers. A misunderstandingof the economic situation will lead to unjustified pessimism about China ’s economy as well as wrongly blaming China for the world’seconomic woes. Worse, the misperception will misguide China ’s policyoptions. Given the depth and persistence of the current round of economicslowdown, a correct understanding and poised reaction is not only essential forChina to surmount the “middle-income trap” and build a moderately prosperoussociety in all respects, but is also pivotal to world economic confidence andoutlook. China ’sthree decades of uninterrupted economic surge and rags-to-riches story areinspirational to developing countries. Yet only by soundly tackling the currentslowdown will the China miracle come to a perfect completion and will the Chinese experience haveconvincing referential value. Thus, China ’s economic slowdown shouldand deserve to be an important topic of discussion in mainstream economics.
Since the adoption of the reform and opening-uppolicy in 1978, China ’seconomy sustained rapid growth for over three decades, with the annual growthrate averaging 9.9% until 2011. Despite some volatility (after growth rate exceeded9% in 1982, it fell below 8% in 1989-1990 and 1998-1999, respectively), theeconomic boom in this period was unprecedented in China’s history. Consideringthe minimum growth target of 8% for this period[1], thispaper defines the first year when China ’s growth continually fellbelow 8%, i.e., 2012, as the starting point of the slowdown. After falling to7.7% in 2012 and 2013, China ’sgrowth rate further dipped to 7.3% and 6.9% respectively in 2014 and 2015.
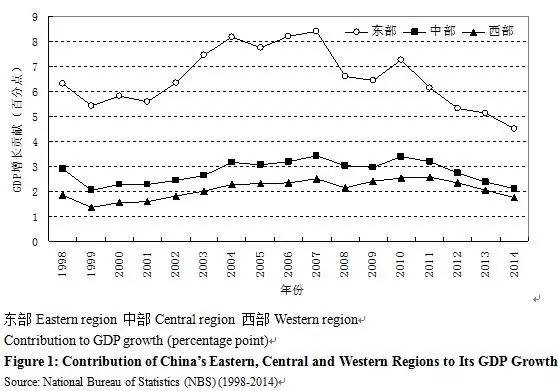
In parallel with the overall slowdown, somepositive changes have occurred in the composition of China ’s economic growth. First ofall, the relationship among growth in the primary, secondary and tertiaryindustries is better aligned, contributing to a healthier economic structure.Traditionally, China ’ssecondary industry had been growing faster than the tertiary industry since1978. Yet in the context of slowdown, growth of the secondary industry fell bya much larger margin; in 2014, contribution by the tertiary industry to GDPgrowth exceeded 50% for the first time, and the tertiary industry thus became amajor engine of growth. Secondly, regional growth and particularly growth among China ’seastern, central and western regions became more balanced. As can be seen fromthe decomposition of GDP growth contribution by region shown in Figure 1[2],the slowdown first struck China ’seastern region and persisted thereafter. On the other hand, thanks to a host ofregional development strategies introduced by the Chinese government, thegrowth rates and contribution of China ’s central and western regionscontinuously increased since 2000, thus narrowing the regional gaps. However, theslowdown in China ’s centraland western regions in 2012 was a key factor behind China ’s slowdown to below 8%.
[1]In the five-year plans and annual plans, economic growthtargets were generally set below 8%. For example, the expected growth rate was set at 7.5% and 7% during the 12th Five-Year and 13th Five-YearPlan periods. However, the 8% economic growth rate was identified at the central government level as a floor to be safeguarded. During the Asian Financial Crisis of 1997 andthe global financial crisis of 2008-2009, for example, China’s central government put forward theobjective to ensure an 8% growth rate.
[2]In the accounting of China’s economic growth rate, theaggregate of provincial growth rates has always been greater than the nationaleconomic growth rate. Therefore, in conducting regional decomposition, China’sgrowth rates of various years are calculated through the aggregation ofprovincial GDP figures, which are obviously higher than the national growthrates released by the NBS. This paperfollowed this method of treatment due to data availability,rather than dueto an assessment of the accuracy of the different data sources.
It needs to be noted that China ’seconomic slowdown coincided with the world economic downturn after the eruptionof the global financial crisis. According to the World Bank’s database, based on2005 US dollar, global GDP growth rate plummeted in 2008 and 2009, down to 1.5%and -2.1% respectively. Despite a short-lived uptick to 4.1% in 2010, growthnosedived again thereafter. From 2011 to 2015, world economic growth ratesregistered 2.8%, 2.3%, 2.4%, 2.5% and 2.4% respectively, failing to restore tothe pre-crisis level.
In 2014, the low-income countries defined by theWorld Bank (with gross national income or GNI per capita below US$1,035) had anaverage GDP growth rate of 6.3%; lower middle-income countries (GNI per capita betweenUS$1,075 and US$4,086) grew by 5.7%; upper middle-income countries (GNI percapita between US$4,086 and US$12,616) grew by 4.6%; and high-income countries(GNI per capita above US$12,616) only grew by 1.7%. At a minimum, this group offigures suggests the following messages: first, countries in different stagesof development have different sources and potentials of growth, hence theirdifferent growth rates; second, China’s growth rate registered 7.3% in 2014,which was significantly above the average growth of 4.6% among countries ofsimilar stages of development and was also much higher than the average growth rateof 6.3% among low-income countries; third, the shift of gears in economicgrowth is a milestone in China’s transition from an upper middle-income status toa high-income status.
Without a doubt, China ’s economic slowdown is partof the world economic slowdown. However, if the above analysis still fallsshort of what needs to be explained, the following sections of this paper willreveal that the new normal of China ’seconomy and the new mediocrity of the world economy are vastly different interms of the manifestations, causes and solutions. Over the years, the “ China collapse”theory in its various versions never failed to crop up every now and then. Thesame authors feasted on every chance by peddling their predictions on China ’seconomy. None of their predictions proved true. Yet this time, China ’s economyfinally slowed down. Some observers and investors or speculators are thus onceagain prompted to join the camp of selling China out. Nevertheless, given theblatant defects in their arguments, this paper does not intend to discuss them unlessnecessary, instead it focuses only on studies that follow economics methodologies,and it will attempt to clarify some misperceptions about China’s economicslowdown to shed light on the real outlook of China’s economy and convince thatthe China miracle will not have ended.
2. Cyclical Perspective Fails to Capture theChange of Development Stage
The most common explanation of China ’s slowdownis the “insufficient demand theory.” For instance, Justin Yifu Lin (2011)explained the recent round of slowdown from demand-side reasons (thus alsocyclical reasons) behind China ’sshrinking net export after the global financial crisis. The theory believesthat once demand bottlenecks are overcome by beefing up investment, a new boom willstart and China ’seconomy will return to its normal track of above 8% growth rates. Similar viewsin favor of stimulating demand hold sway among Chinese and internationaleconomists. However, unlike Justin Yifu Lin (2011), not many studies providedempirical evidence. By comparing the per capita GDP of an economy to the levelof the United States as ameasurement of the development stage, Justin Yifu Lin discovered that China ’s current per capita GDP is equivalent to20% of that of the United States . This level of development was what Japan achieved in 1951, Singapore in 1967, Chinese Taiwan in 1975 and South Korea in1977. Data suggest that in the two decades after reaching this level, theabove-mentioned economies respectively scored annual economic growth rates of9.2%, 8.6%, 8.3% and 7.6%. The conclusion thus arrived at is that China stillenjoys great potentials of rapid growth for years to come. However, such amethod of comparing development stages fails to take demographics into account.
It has been proven ineconomic history that an increasing proportion of working-age population andfalling dependency ratio will bring about demographic dividends that propel growth.Using an econometric model, Cai and Zhao (2012) decomposed China ’spost-1978 growths into the following factors. First, as a low dependency ratiocreated conditions for a high savings rate and unlimited supply of laborbolstered marginal return to capital, capital accumulation in China has majordriver of growth. Second, an abundance of labor supply and growing levels ofeducation (human capital) are undoubtedly conducive to economic growth. Third,the transfer of labor from agriculture to urban jobs enhances resource reallocationefficiency, which is responsible for nearly half of China ’s total factor productivity(TFP) improvement. All of these factors underpinning China ’s economic growth are aresult of favorable demographics.
Hence, demographics cannotbe overlooked in reckoning China ’sdevelopment stage and future growth outlook. Whether demographics areconsidered or neglected will lead to vastly different conclusions in viewingstage of development, i.e., if the growth tendency of the working-agepopulation is factored in, the conclusion will be very different from thatbased on per capita GDP. Specifically, if the year when China ’s working-age population aged between 15and 59 years peaked is used as the benchmark of comparison, China ’s development stage in 2010 was actuallyequivalent to the level of Japan between 1990 and 1995, the level of South Korea between 2010 and 2015 and the level of Singapore between 2015 and 2020. Ifthe dependency ratio (population aged below 14 years plus population aged above60 years divided by population aged between 15 and 59 years), which oftenserves a proxy variable of demographic dividends in econometric modeling, isused,, the time points it bottomed for Japan, South Korea and Singapore aremuch later than the time points defined by their per capita income levels(Figure 2). For instance, while Japan ’sdependency ratio fell to the lowest point around 1970, it did not spike untilthe 1990s. The rising dependency ratios of South Korea and Singapore are generallysynchronous with China ’s.
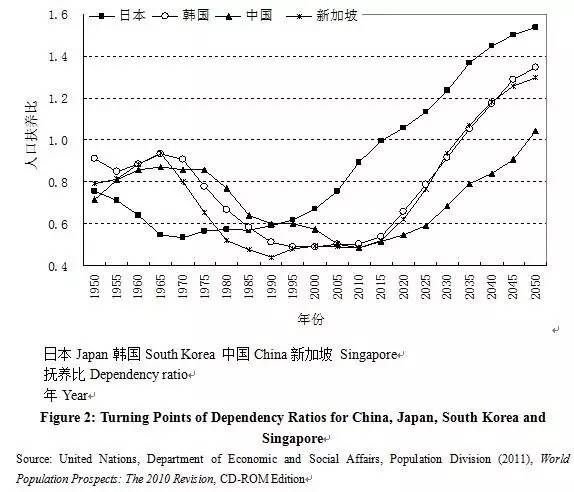
That is to say,relative to per capita GDP, China ’sdemographic transition is much steeper and its turning point of demographicdividends arrives much earlier. Given China ’sthree-decade reliance on demographic dividends, which are diminishing, China ’s potential growth rate should beestimated using another approach, which leads to different forecasts of China ’seconomic outlook with very different policy implications. Based on the tendencyof demographic change and its impact on production factors and TFP, Cai Fangand Lu Yang (2013) estimated China ’spotential GDP growth between 1979 and 2020. Judging by the average numbers ofvarious timeframes, China ’spotential GDP growth was 9.66% between 1979 and 1994, 10.34% between 1995 and2010, down to 7.55% between 2011 and 2015, and is projected to further dip to6.20% between 2016 and 2020.
By subtracting potentialgrowth rates from actual growth rates, we may arrive at the growth gaps forvarious years (Figure 3), which help take stock of the macroeconomic volatilitysince China ’sreform and opening-up initiated in 1978. In Figure 3, the cases of actual growthrates being above potential growth rates represent positive gaps, while that ofreal growth rates being below potential growth rates represent negative gaps.In the figure, the years with significant negative gaps correspond tomacroeconomic downturns. If potential growth rate is viewed in the context of aspecific development stage, production factors supply and TFP improvementpotentials that are considered endowments of a given time can support aneconomy to realize its potential of growth; yet negative gaps normallycorrespond to cyclical disturbance from the demand side, preventing actual growthfrom reaching its potentials and production factors from being fully utilized.At this moment, such problems as insufficient utilization of production factorsas reflected in cyclical unemployment would occur. By the same token, anopposite situation is positive gaps resulting from actual growth rate abovepotential growth rate, which corresponds to economic overheating, as reflectedin inflation or economic bubbles.
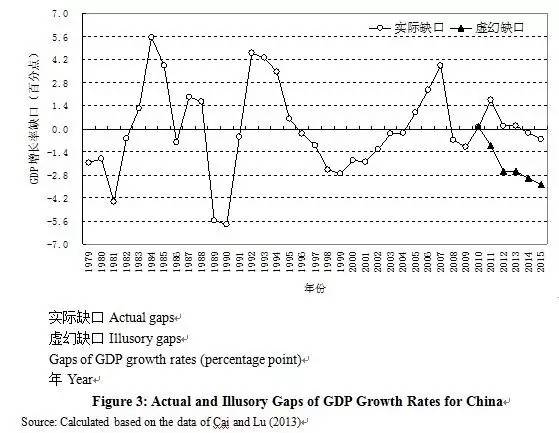
Based on the potentialgrowth rates between 1979 and 1994 and between 1995 and 2010 reckoned by CaiFang and Lu Yang (2013), the gaps of growth rates for these timeframes can becalculated by subtracting the average potential growth rates from the actual growthrates in the corresponding years. In these timeframes, China ’seconomic growth demonstrated three cycles of volatility, creating four troughsin 1981, 1990, 1999 and 2009, and the length of each cycle coincided with what wasconsidered the “Juglar Cycle.” As a result of shifting stage of development,the average potential growth rates will drop to 7.55% and 6.2% for the periodsbetween 2011 and 2015 and between 2016 and 2020, respectively. Following thesame method of calculation, there is barely any gap of growth rate in thecurrent slowdown (see the hollow circular curve tendency in Figure 3). However,if China ’seconomy is habitually considered to maintain the original level of growthwithout recognizing declines in potential growth rate, e.g., if the 10.34% rateduring the period between 1995 and 2010 is used as a benchmark, the gaps ofgrowth rate could be illusorily observed (see the results shown in the solidtriangular curve in Figure 3).
Gaps of growth rateare not unique to China but represent a subject of macroeconomics and a situation that needs to bedealt with in macroeconomic policy-making. For advanced economies, long-termgrowth trends can be seen as potential growth rates as their economic growth isnormally under the neoclassical steady state, and the gaps of growth ratestemming from faster or slower real growth are manifested as economic cycles.In this sense, frequent growth volatility is a cyclical phenomenon. Whennegative gaps of growth occur, attention is naturally drawn to the demand sidefor a way out. Despite contradictory arguments from different schools of macroeconomics,whenever the economy is in recession, governments and central banks are temptedto resort to fiscal or monetary policies or a combination of both to resistcyclical volatility.
The “real businesscycle theory” attempts to eliminate the boundary between cycle and growth,recognizing that productivity shocks could change the normality of growth rate.Yet this school of theory focuses on the negation of cycles caused bydemand-side shocks rather than differentiates between cyclical phenomenon andgrowth stages. While this theory deserves our attention is that cyclical andgrowth issues are interchangeable and interwoven, whether in terms of theory orpractice, it is necessary to classify slowdown into cyclical slowdown andchange of development stage, especially when China as a fast-growing andrapid-changing case is considered.
The lesson of Japan ’s “lostthree decades”, where the economic slowdown was seen as a demand-side problemin the 1970s when the country’s demographic dividends diminished, should be learned. In response to its slowdown,the Japanese government adopted an extremely loose macroeconomic policy andinterventionist industrial policy. Instead of boosting the real economy andinfrastructure, however, unleashed liquidity and broad money led toskyrocketing asset prices and unprecedented economic bubbles, which finallyburst and dragged the economy into recession. In tackling the recession afterthe burst of asset bubbles, the Japanese government continued to adopt stimuluspolicies that protected obsolete firms and created zombie firms, which took atoll on overall innovation and TFP (Hayashi and Prescott, 2002), bringing aboutvarious supply-side hurdles to potential economic growth.
For China , theeconomic slowdown since 2012 resulted from a falling potential growth rate as aresult of demographic transition or change in the stage of economicdevelopment. Therefore, there were no negative gaps of growth rate. Asdemonstrated in another article of author’s, the slowdown did not lead tocyclical unemployment and labor shortage continued to beleaguer China ’s economy(Cai, 2016). In approaching China ’sslowdown, macroeconomists should eye a longer horizon of growth instead of beingconfined to the traditional cyclical perspective. On the other hand, while theproblem facing us isa long-term growth phenomenon, there is no doubt that aneconomy could be struck by cyclical problems at any time, so we must stayvigilant and pay close attention to both changes in the development stage andcyclical volatility.
3. Convergence Perspective Has Missed China Story
Economists indeed approach China ’s slowdown from theperspective of economic growth. For instance, Pritchett and Summers (2014)considered that any growth rate above the average level is abnormal and has toregress towards the mean, which is understood to be the average growth rate of theworld economy. This methodology is based on the famous Galton’s Fallacy, i.e., the average height of the membersof an extended family cannot stay abnormal over a long period of time and tendto regress towards the average level of the overall population. The samestatistical pattern is followed in economic growth. According to their forecast, China ’seconomic growth will fall to 5.01% between 2013 and 2023 and further fall to3.28% between 2023 and 2033, i.e., what Pritchett and Summers referred to asthe “mean.”
The two authors applied “regression towards the mean” to explain China ’sslowdown and claimed that such a statistical pattern was unavoidable. With aset of panel data, their argument overshadowed the protracted and varied growthpractices of numerous countries, overlooking the catch-up attributes ofdeveloping countries. Since this argument fails to explain the spectaculargrowth that took place in catching-up economies like Japan ,the Four Asian Tigers and China ,and since it does not provide any reasonable interpretation of China ’sslowdown, the “regression towards the mean” prediction is not convincing.Delineating the growth percentages of China ’s economy in the coming 20years following this methodology is like making a pair of “mean-sized” shoesfor everybody in the world, regardless of their gender, age and size.
Barro (2016) arrived at a similar prediction andconclusion, i.e., China ’seconomic growth rate will swiftly fall to the level of 3% to 4%, thus missingthe official growth targets of 6% to 7% set for the 13th Five-YearPlan (FYP) period (2016-2020). His argument is based on his copyrighted“conditional convergence” analytical framework. In his growth regression model,the determinants of growth rate are classified into the following two types:first, the convergence effect with initial per capita GDP (in logarithm) as anindependent variable; second, the group of explanatory variables that determinesthe steady state of growth (otherwise referred to as “X variables”). Afternumerous rounds of growth regression, he developed what he believed to be the“iron law of convergence”, i.e., it is impossible for a country to convergewith a more advanced economy or its own steady state with a growth rate thatdeviates from 2% over a long period of time; now that China’s growth hassignificantly outstripped what is predicted under this model, it is thusunlikely for China to maintain its current growth momentum in the future.
Granted, with a rising per capita income level andnarrowing potentials of convergence, slowdown is undoubtedly a natural outcome.However, even if Barro’s analytical framework of convergence is recognized,numerous X variables that affect growth still exist outside the law ofconvergence. Barro conceded that for a particular economy, there could beunique X variables or country-specific attributes that defy the so-called “ironlaw” or “mean”. For instance, Barro and his collaborator (Barro andSala-i-Martin, 1995) incorporated more than 100 explanatory variables intotheir growth regression model and discovered their significance. China ’seconomic growth story not only has general significance but is unique as well.Overlooking China ’suniqueness will cause China ’sgrowth potentials to be underestimated and the timing and extent of itsslowdown to be misjudged[1].
Eichengreen et al. (2011) do not admit any iron law ofeconomic slowdown. They made special efforts in identifying the country-specificfactors of slowdown in economy and TFP. According to their findings, an economywill encounter two rounds of deceleration when its per capita GDP in 2005purchasing power parity term is in the range between US$10,000 and US$11,000and between US$15,000 and US$16,000, respectively. By their definition, China has yetto reach the typical starting point of slowdown, i.e., US$10,000, but partiallymeets the definition of slowdown, i.e., its growth rate dropped from about 10%before 2012 to less than 8% afterwards, down two or three percentage points.Although comparison is conducted between the average growth rates of sevenyears before the slowdown and seven years after the slowdown, what we know forsure is that China ’seconomy indeed cannot return to its 10% growth rate.
In another paper, Eichengreen et al. (2013) identified afew common factors related to slowdown, including,inter alia, the “regression towards the mean” effect, diminishingdemographic dividends caused by population ageing, falling returns as a resultof high investment rates, as well as an underestimated exchange rate thatimpedes the upgrade of industrial structure. They also identified some factorsthat can reduce the probability of slowdown, such as better human capital accumulation.However, they did not present a clear account of the causal relationshipbetween certain factors and slowdown, nor did they distinguish cyclical factorsfrom growth factors. On the other hand, they laid no special emphasis on theimportant findings in their earlier paper (Eichengreen et al., 2011), i.e., TFPreduction can explain 85% of economic slowdown. Nevertheless, this omission wascompensated for in another paper by the same authors specifically on TFPslowdown (Eichengreen et al., 2015).
The definition of economic slowdown by Eichengreen et al. is that growthrate declines by two or three percentage points before and after the turningpoint of slowdown. The difference between their average case in general andChina case in particular is that the decline of growth rate from 5.6% to 2.1%(down 3.5 percentage points) observed in the data of various countries(Eichengreen et al., 2013) has different significance from China’s fallinggrowth rate from 11.3% in the 11th FYP period to 7.8% in the 12thFYP period (also down by 3.5 percentage points). That is, while the formerrepresents a drop of 62.5%, the latter represents a drop of only 31.0%. Even attoday’s rate, China ’seconomic growth still passes for rapid growth by international standards. Whereasslowdown is an inevitable result of the change in development stage, numerousopportunities exist to help prevent China ’s deceleration from evolvinginto stagnation or becoming too severe.
[1]For instance, due to the wrong choice of explanatory variables and values, Barro(2016) estimated China’s per capita GDP growth rate in 2015 to be 3.5%, which was dwarfed by the real growth rate of 6.9% inthat year. Actually, huge differences can be found in comparing his estimatesof China’s per capita GDP growth for various years and the actual growth rates.
